


k3s Cluster on ARM-based Rock64 SoCs
k3s cluster on ARM-based Rock64 SoCs
To quickly and easily test k3s for edge use cases I’ve been running a single master + single worker node configuration on a couple Rock64’s purchased from Ameridroid. For less than $130 (shipped) I purchased 2x Rock64 4GB models along with the requisite 5V/3A power adapters. Yes, I would now prefer to run k3s (among other things) on an Nvidia Jetson Nano, but I bought my Rock64’s well before the Nano was released and I also had a second project in mind, similar to Project31’s use of Pine64 SoCs to run OpenShift in a CentOS 7 user space. I was actually able to use those base CentOS 7 images to run OpenShift 3.7 on ARM, but it was heavy and a bit messy.
I’ve since switched to running Debian 9 (Stretch) on my Rock64s with k3s, which has worked great. This provides a solid foundation for a running 2-node k3s cluster.
Prerequisities
Hardware
- Rock64 4GB
- Any ARM SoC should work fine, but more memory translates to better support for a higher density of running containers
- microSD Card (8GB to 32GB)
- USB to TTL CH340G UART Serial Adapter (OPTIONAL)
Software
Bootstrap Rock64
Image microSD
-
After downloading and extracting the Debian Stretch microSD image use
ddor Etcher to write the image. Update theDEVICEvariable to reflect your microSD alias:If you’d prefer to execute the download and image write all in one step:export DEVICE=/dev/mmcblk0 xz -k -d -c -v -T 3 stretch-minimal-rock64-0.8.3-1141-arm64.img.xz | dd bs=30M of=$DEVICEexport DOWNLOAD_URL="https://github.com/ayufan-rock64/linux-build/releases/download/0.8.3/stretch-minimal-rock64-0.8.3-1141-arm64.img.xz" export ARCHIVER="xz -d" export DEVICE=/dev/mmcblk0 curl -L -f "$DOWNLOAD_URL" | $ARCHIVER | dd bs=30M of=$DEVICE -
Repeat for your second Rock64, then eject and insert the microSD cards into your SoCs
Connect USB to TTL/UART Serial
This is optional but provides insight in the event of startup failure(s). This is especially useful if you ever decide to PXE boot your Rock64s (after flashing SPI memory)and need to diagnose boot failures. Once you’re connected via serial, you can easily login with the default username/password combo (rock64/rock64) and determine the system IP. It’s just as easy to determine DHCP IP via your local server, too – my home network is all Ubiquiti, so it’s easy enough to see dynamic assignment via ER-X CLI/web console. Resources to help get you moving on serial console connectivity with Rock64 SOCs:
Configure Hosts
Feel free to execute this individually or via Ansible now that you should have IP addresses associated with your devices
- Set some clean hostnames for each Rock64 device
Install k3s
Master Node
Choose one of your Rock64s to act as the master, or optionally use any spare system you have laying around (including your laptop).
-
Install k3s by executing the following command. Note that you can leave the version parameter off, but I prefer to specify a specific version to ensure nodes and masters are running the same version at all times:
curl -sfL https://get.k3s.io | INSTALL_K3S_VERSION=v0.8.0 sh - -
Once the download/install is complete confirm you have a single node cluster running:
kubectl get nodes -
Grab the node-token needed to add your second node:
cat /var/lib/rancher/k3s/server/node-token
Worker Node(s)
-
Using the input from step (3) in the Master Node configuration section, launch your second node, making sure to replace
K3S_URLwith your master hostname andK3S_TOKENwith your specific token:
curl -sfL https://get.k3s.io | \ K3S_URL=https://rock1.gxr.me:6443 \ K3S_TOKEN=K101147f0c4bd67e39669d60821d3c1be90cb84f4bdb20e5c97f0cdc0a35319::node:53254ffabcf3c707fd61715c2ea8 \ INSTALL_K3S_VERSION=v0.8.0 sh - -
Once the download/install/configuration is complete confirm you see both nodes in the cluster running. Note this must be run from your master node [as root], which should reference the appropriate kubeconfig:
kubectl get nodes
Sample output:
  root@rock1:~# kubectl get nodes
  NAME           STATUS   ROLES    AGE    VERSION
  rock1.gxr.me   Ready    master   7d7h   v1.14.5-k3s.1
  rock2.gxr.me   Ready    worker   7d3h   v1.14.5-k3s.1
Install Kubernetes Dashboard
This isn’t difficult, but it does require a change to the default deployment configuration.
-
Head to the project homepage: https://github.com/kubernetes/dashboard
-
Per documentation, deploy the dashboard, which will target namespace
kube-systemby default:kubectl apply -f https://raw.githubusercontent.com/kubernetes/dashboard/v1.10.1/src/deploy/recommended/kubernetes-dashboard.yaml -
The preceding deployment will fail since it attempts to use the
amd64image by default. Patch the deployment configuration to usearm64and wait for a successful deployment:kubectl -n kube-system patch deployment \ kubernetes-dashboard \ --patch '{"spec":{"template":{"spec":{"containers":[{"name":"kubernetes-dashboard","image":"k8s.gcr.io/kubernetes-dashboard-arm64:v1.10.1"}]}}}}' -
Expose the dashboard using NodePort rather than relying exclusively on Traefik:
kubectl expose deployment kubernetes-dashboard -n kube-system --type=NodePort --name=k8s-dashboard -
Discover the auto-assigned NodePort for the kubernetes dashboard, which in this case is 31723/TCP:
kubectl get svc -n kube-system ### Sample Output: NAME TYPE CLUSTER-IP EXTERNAL-IP PORT(S) AGE k8s-dashboard NodePort 10.43.146.133 <none> 8443:31723/TCP 2d3h -
Make the
admin-userservice account, which should exist with a fresh k3s install, a cluster administrator:kubectl create clusterrolebinding owner-cluster-admin \ --clusterrole cluster-admin \ --user system:serviceaccount:kube-system:admin-user -
Grab the perpetual token associated with
admin-user:kubectl -n kube-system describe secret $(kubectl -n kube-system get secret | grep admin-user | awk '{print $1}') | grep token:

- Test login by accessing https://master:nodeport – in my particular case, I would access: https://rock1.gxr.me:31723
- Select Token for the login method and use the output from step (7) to authenticate
- You should now be able to monitor and interact with your cluster resources using the web UI
Install Traefik + Web UI
Deploying Traefik is trivial, but if you want a functional web UI for monitoring then a few extra steps are required. The credit for this goes to a mpromonet on GitHub:
-
Edit the Configuration Map included with the default Traefik deployment:
Add the following contents to the configmap:kubectl edit cm traefik -n kube-systemdefaultEntryPoints = ["http","https"] [api] [entryPoints] [entryPoints.traefik] address = ":8880" [entryPoints.http] -
Update the service to include your new API port TCP8880:
kubectl -n kube-system patch svc traefik \ --patch '{"spec":{"ports":[{"name":"api","port":8880,"protocol":"TCP"}]}}' -
Create or update the ingress definition to include your new exposed service, making sure to edit the
hostparameter to match your hostname and/or IP. In my case, I’m using xip.io addresses (e.g. traefik.192.168.1.222.xip.io):
apiVersion: extensions/v1beta1
kind: Ingress
metadata:
  name: traefik-web-ui
  namespace: kube-system
spec:
  rules:
  - host: traefik.192.168.1.222.xip.io
    http:
      paths:
      - path: /
        backend:
          serviceName: traefik
          servicePort: 8880
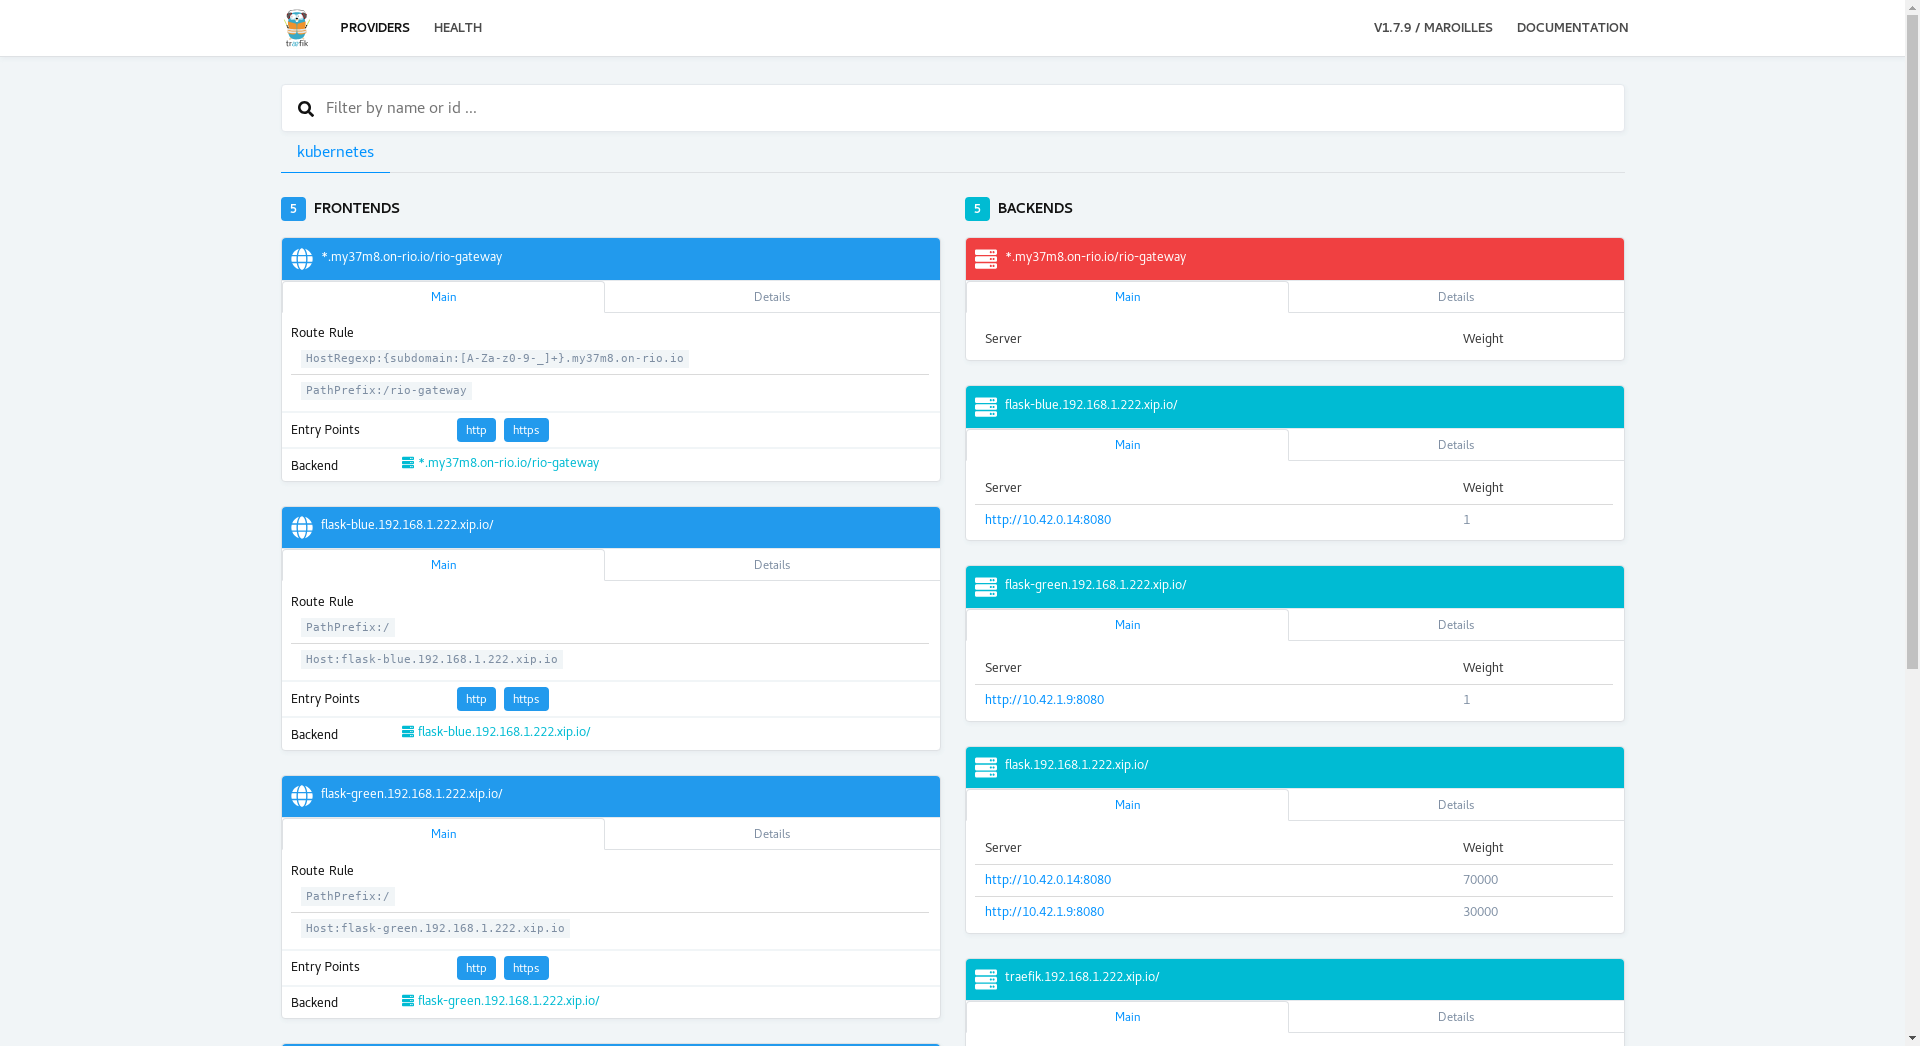
host defined above. In my case, http://traefik.192.168.1.222.xip.io
Test a Workload with Ingress Routes
Now that you’ve established a k3s cluster, loaded the k8s dashboard, and reconfigured the Traefik web UI, you’re ready to load a test workload. If you’re running this test on an ARM-based cluster, you can load up a simple nginx web container image serving content on TCP 80 in the default namespace:
kubectl -n default create -f https://raw.githubusercontent.com/kubernetes/website/master/content/en/examples/application/deployment.yaml
kubectl -n default patch deployment nginx-deployement '{"spec":{"template":{"spec":{"containers":[{"name":"nginx","image":"nginx:latest"}]}}}}'
kubectl -n default expose deployment nginx-deployment
Great, now we need an ingress route:
cat <<EOF | kubectl apply -f -
apiVersion: extensions/v1beta1
kind: Ingress
metadata:
  name: nginx-ingress
spec:
  rules:
  - host: nginx.192.168.1.222.xip.io
    http:
      paths:
      - path: /
        backend:
          serviceName: nginx-deployment
          servicePort: 80
EOF
Last, just curl your host to ensure the nginx “Welcome” page is displayed:
root@rock1:~/k3s-r64-flask# curl http://nginx.192.168.1.222.xip.io/
<!DOCTYPE html>
<html>
<head>
<title>Welcome to nginx!</title>
References
- https://github.com/umiddelb/aarch64/wiki/Install-CentOS-7-on-your-favourite-ARMv8-ARM64-AArch64-board/07d7acb524ed99cb27ed6e221fd1ed6d2ad7839f
- High level overview of getting CentOS working with Rock64 by using Armbian and CentOS user land rootfs
Notes
- The velocity of change in Rancher projects never ceases to amaze me:
- You could easily opt to use k3os rather than leveraging an OS specific to your ARM devices. That said, you still need to perform an Overlay Installation which still uses your chosen bootloader/kernel with the k3os user space. It saves a bit of time downloading/configuring k3s and/or your own prerequisites (e.g. hostname, network config, etc.) by levering cloud-init style configuration, much like an Ignition configuration for CoreOS, or OpenShift 4 for that matter.
Feature Image by [Andrew Malone] (https://www.flickr.com/photos/andrewmalone/2177361233/in/photostream/) is licensed under CC BY 2.0
Share this post
Twitter
Google+
Facebook
Reddit
LinkedIn
StumbleUpon
Pinterest
Email